Discovery
Before a dashboard,
we needed data worth showing.
Engineers walked me through their Excel files in live screen-share sessions. Finding a value meant searching for a part number, copying reference data and checking supplier information. I mapped the work as it happened.
The journey revealed a dependency. Consolidation needed dependable inputs. I argued for a data-collection MVP: give engineers a place to document part-level CO₂ values before building the dashboards on top.
Project stages · from the original map
Scroll through the stages.
- Initiate project
- IVL delivery
- Analysis
- Mitigation roadmap
Selected working view · System owner
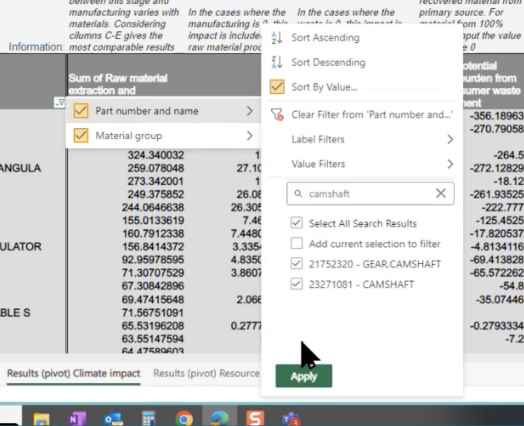
Recorded pain
“User has to find every part number to copy IVL values to own sheet.”
Data limitation
IVL reference data had limits. The map records supplier lifecycle data as more reliable for the final decision.

Workspace
Keep the source
in the engineer's working view.
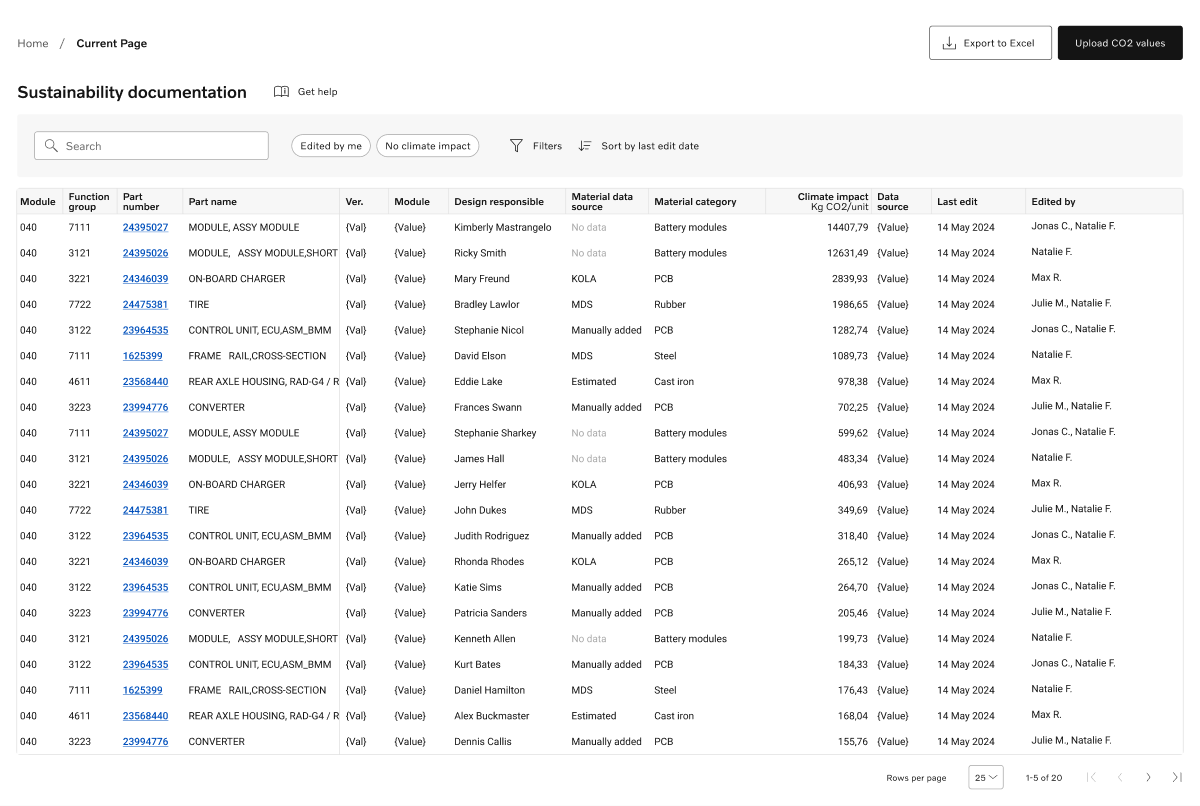
I proposed a Material data source column in the parts table. Reference-system values, manual entries and estimates carry different labels. Missing data stays visible. Engineers can inspect the origin of a value while working with it.
The table combines part context with climate impact per unit. Import sits above it. The upload flow checks the product before accepting baseline files, so input errors can be corrected where the data enters.
Full-size view. Scroll to inspect the rest of the table.
Takeaway
Excel export was
part of the adoption plan.
I kept Excel export deliberately. Engineers could take the shared data back to the spreadsheets they already knew. The design could improve the source of their numbers while keeping a familiar way to work.
The design used 2024 emissions data from the T146 and T03 reference trucks. That is the evidence available. I don't have adoption or time-saving figures for this project.