Context
The shift meeting
started at the board.
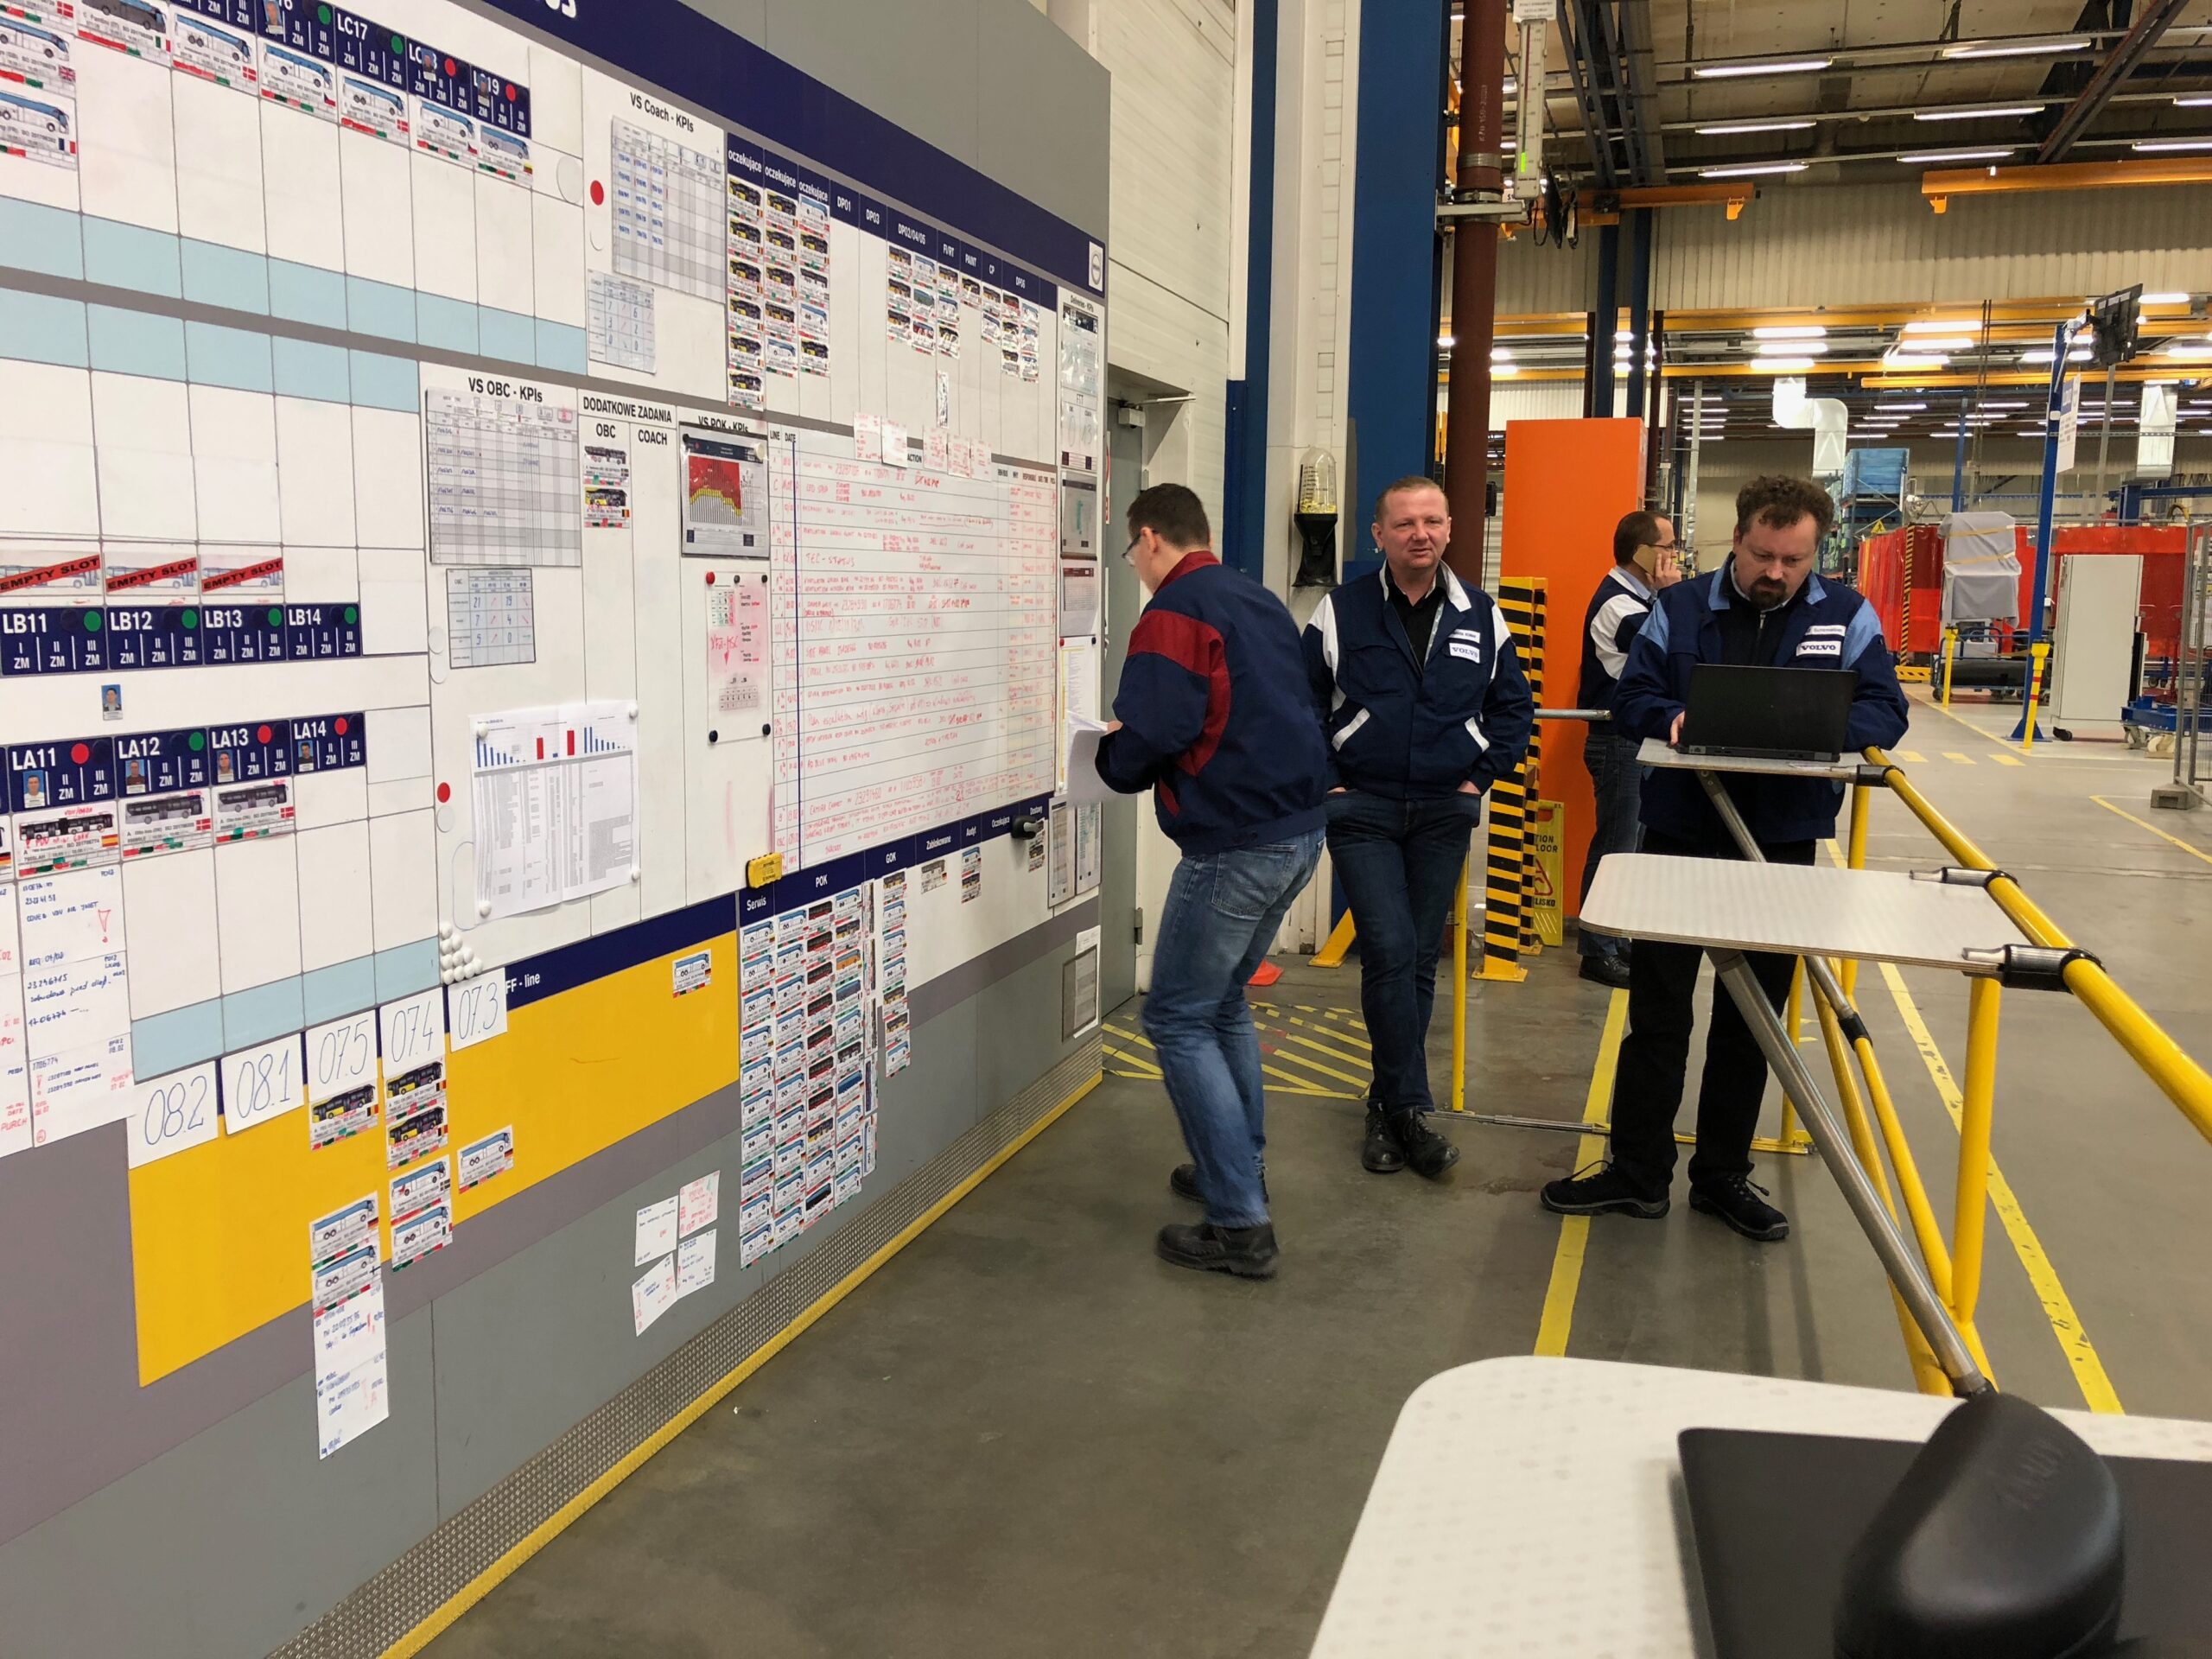
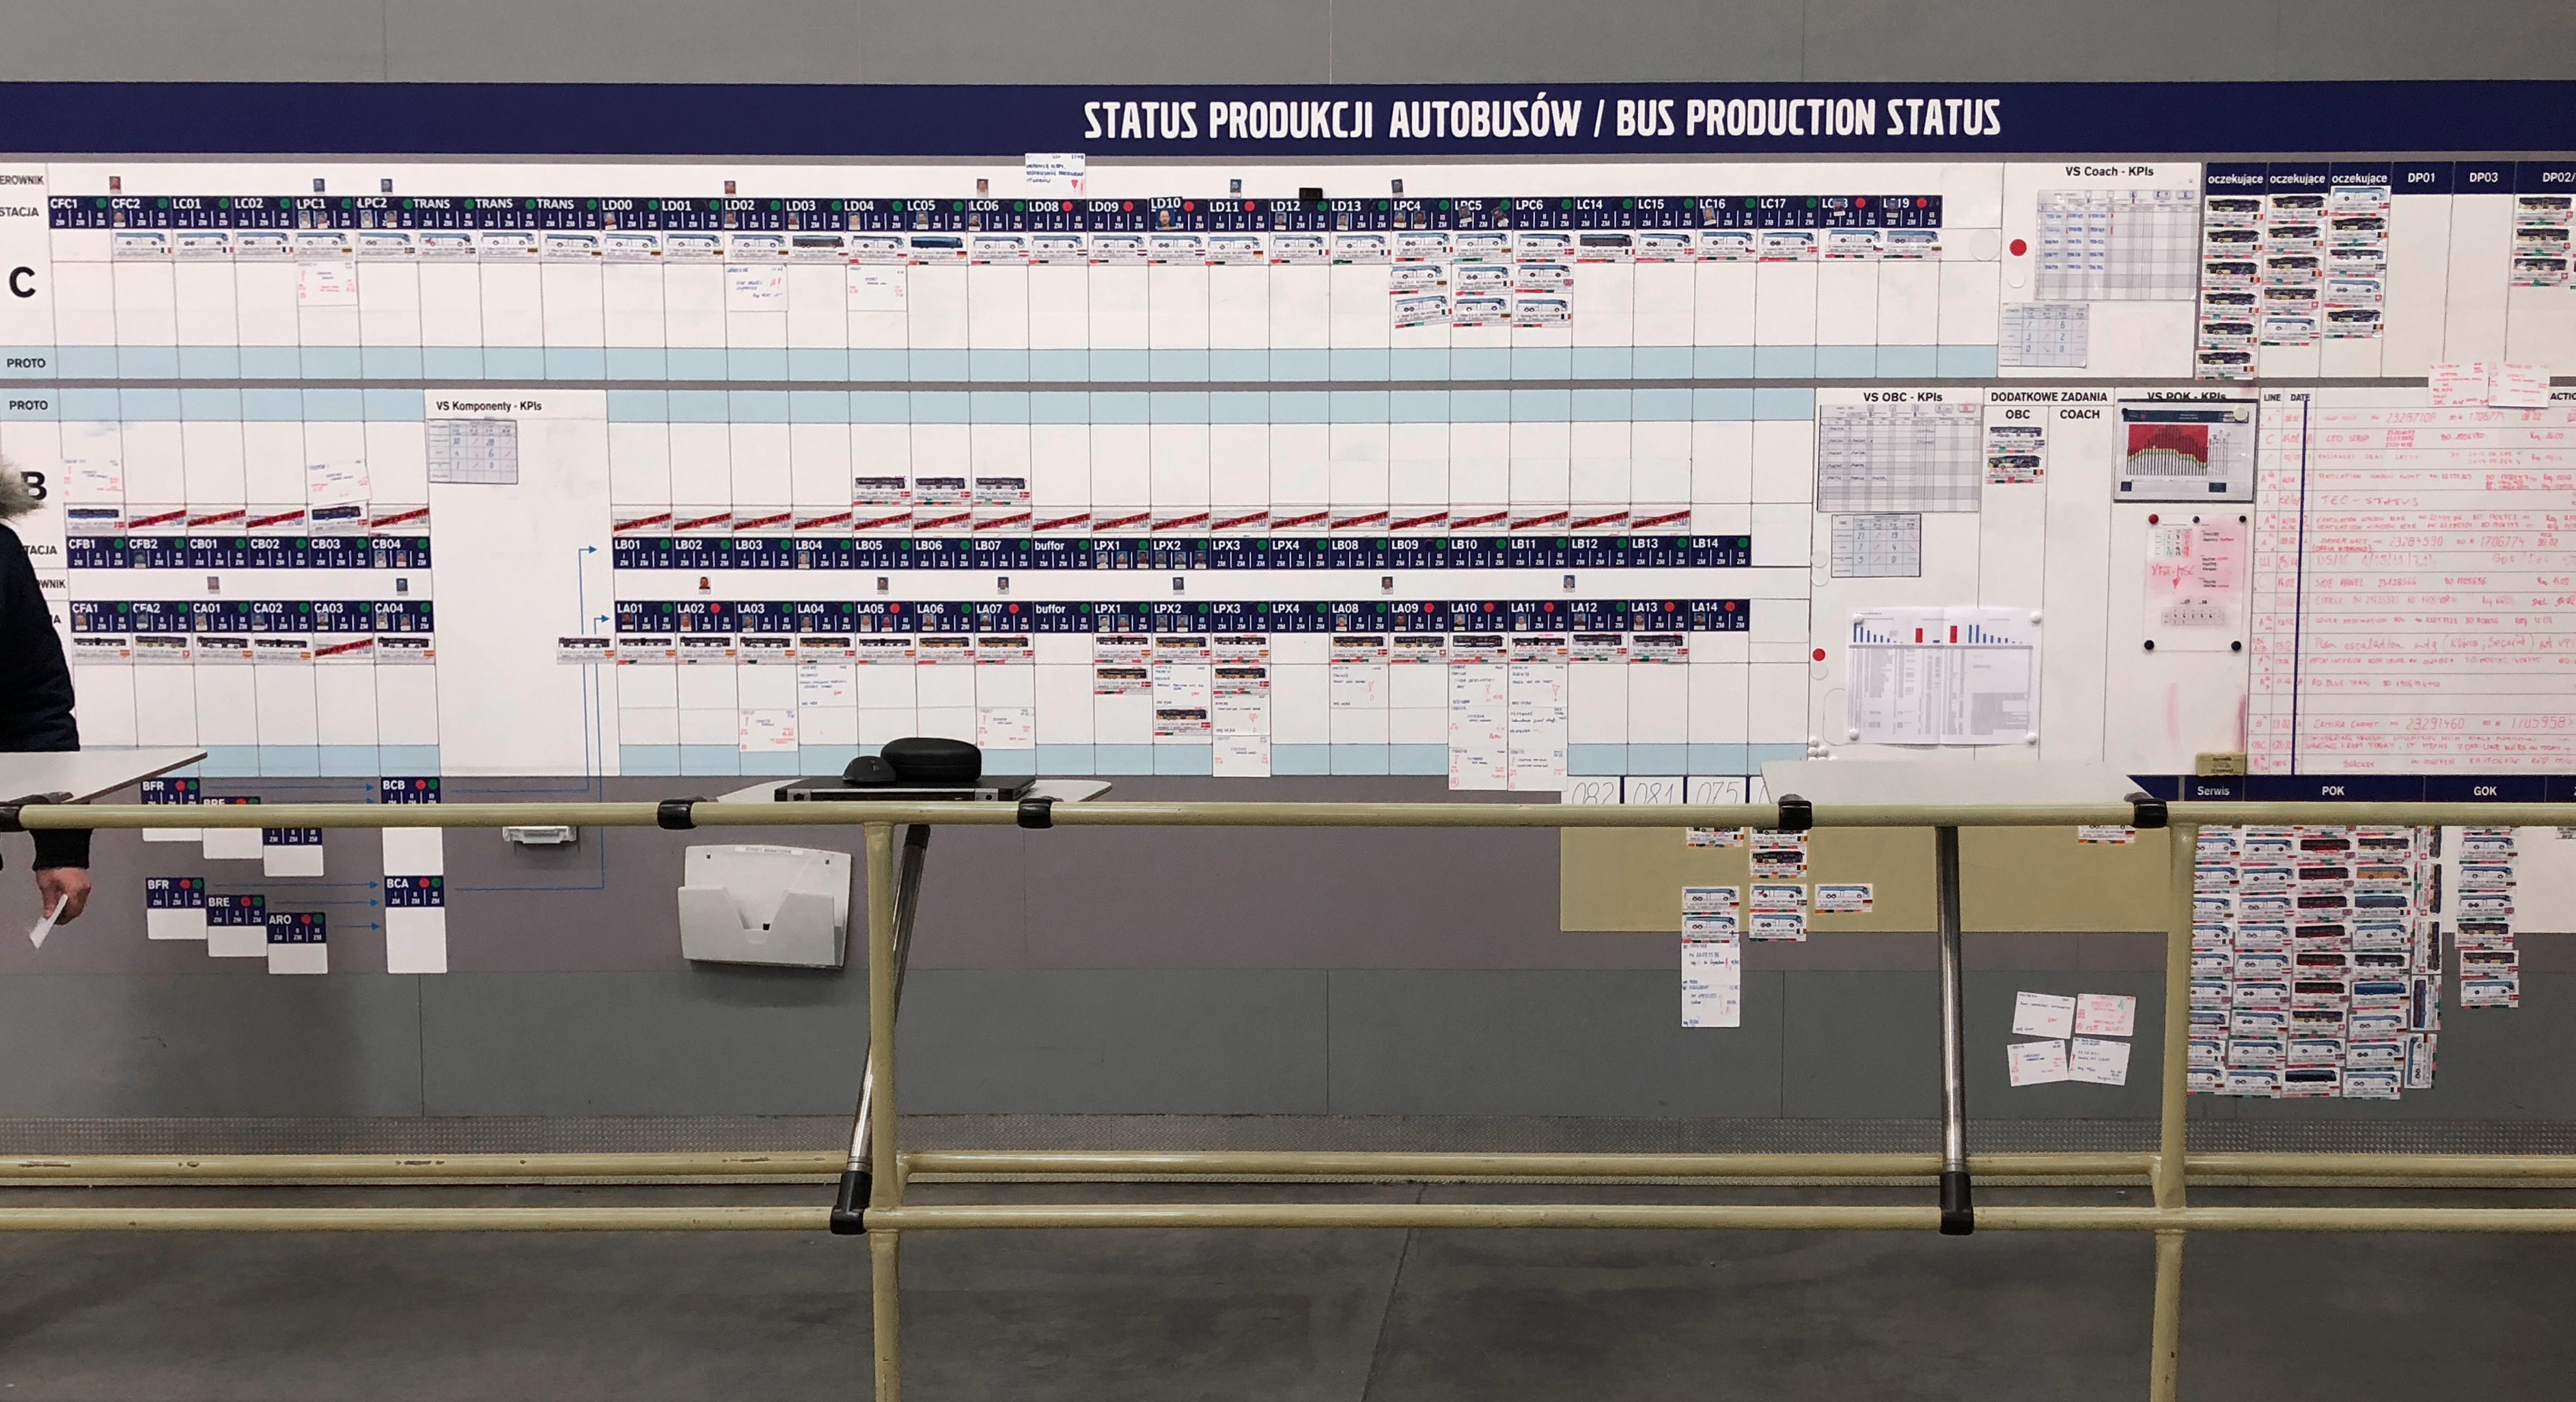
Managers updated production cards by hand and gathered at the board to discuss problems. A vehicle's position showed where it sat in production; attached notes added the issues that needed attention. Keeping that view current took repeated preparation.
The board gave the team a shared way to read the factory floor. I started with that structure.
Discovery
The card's position
carried part of its meaning.
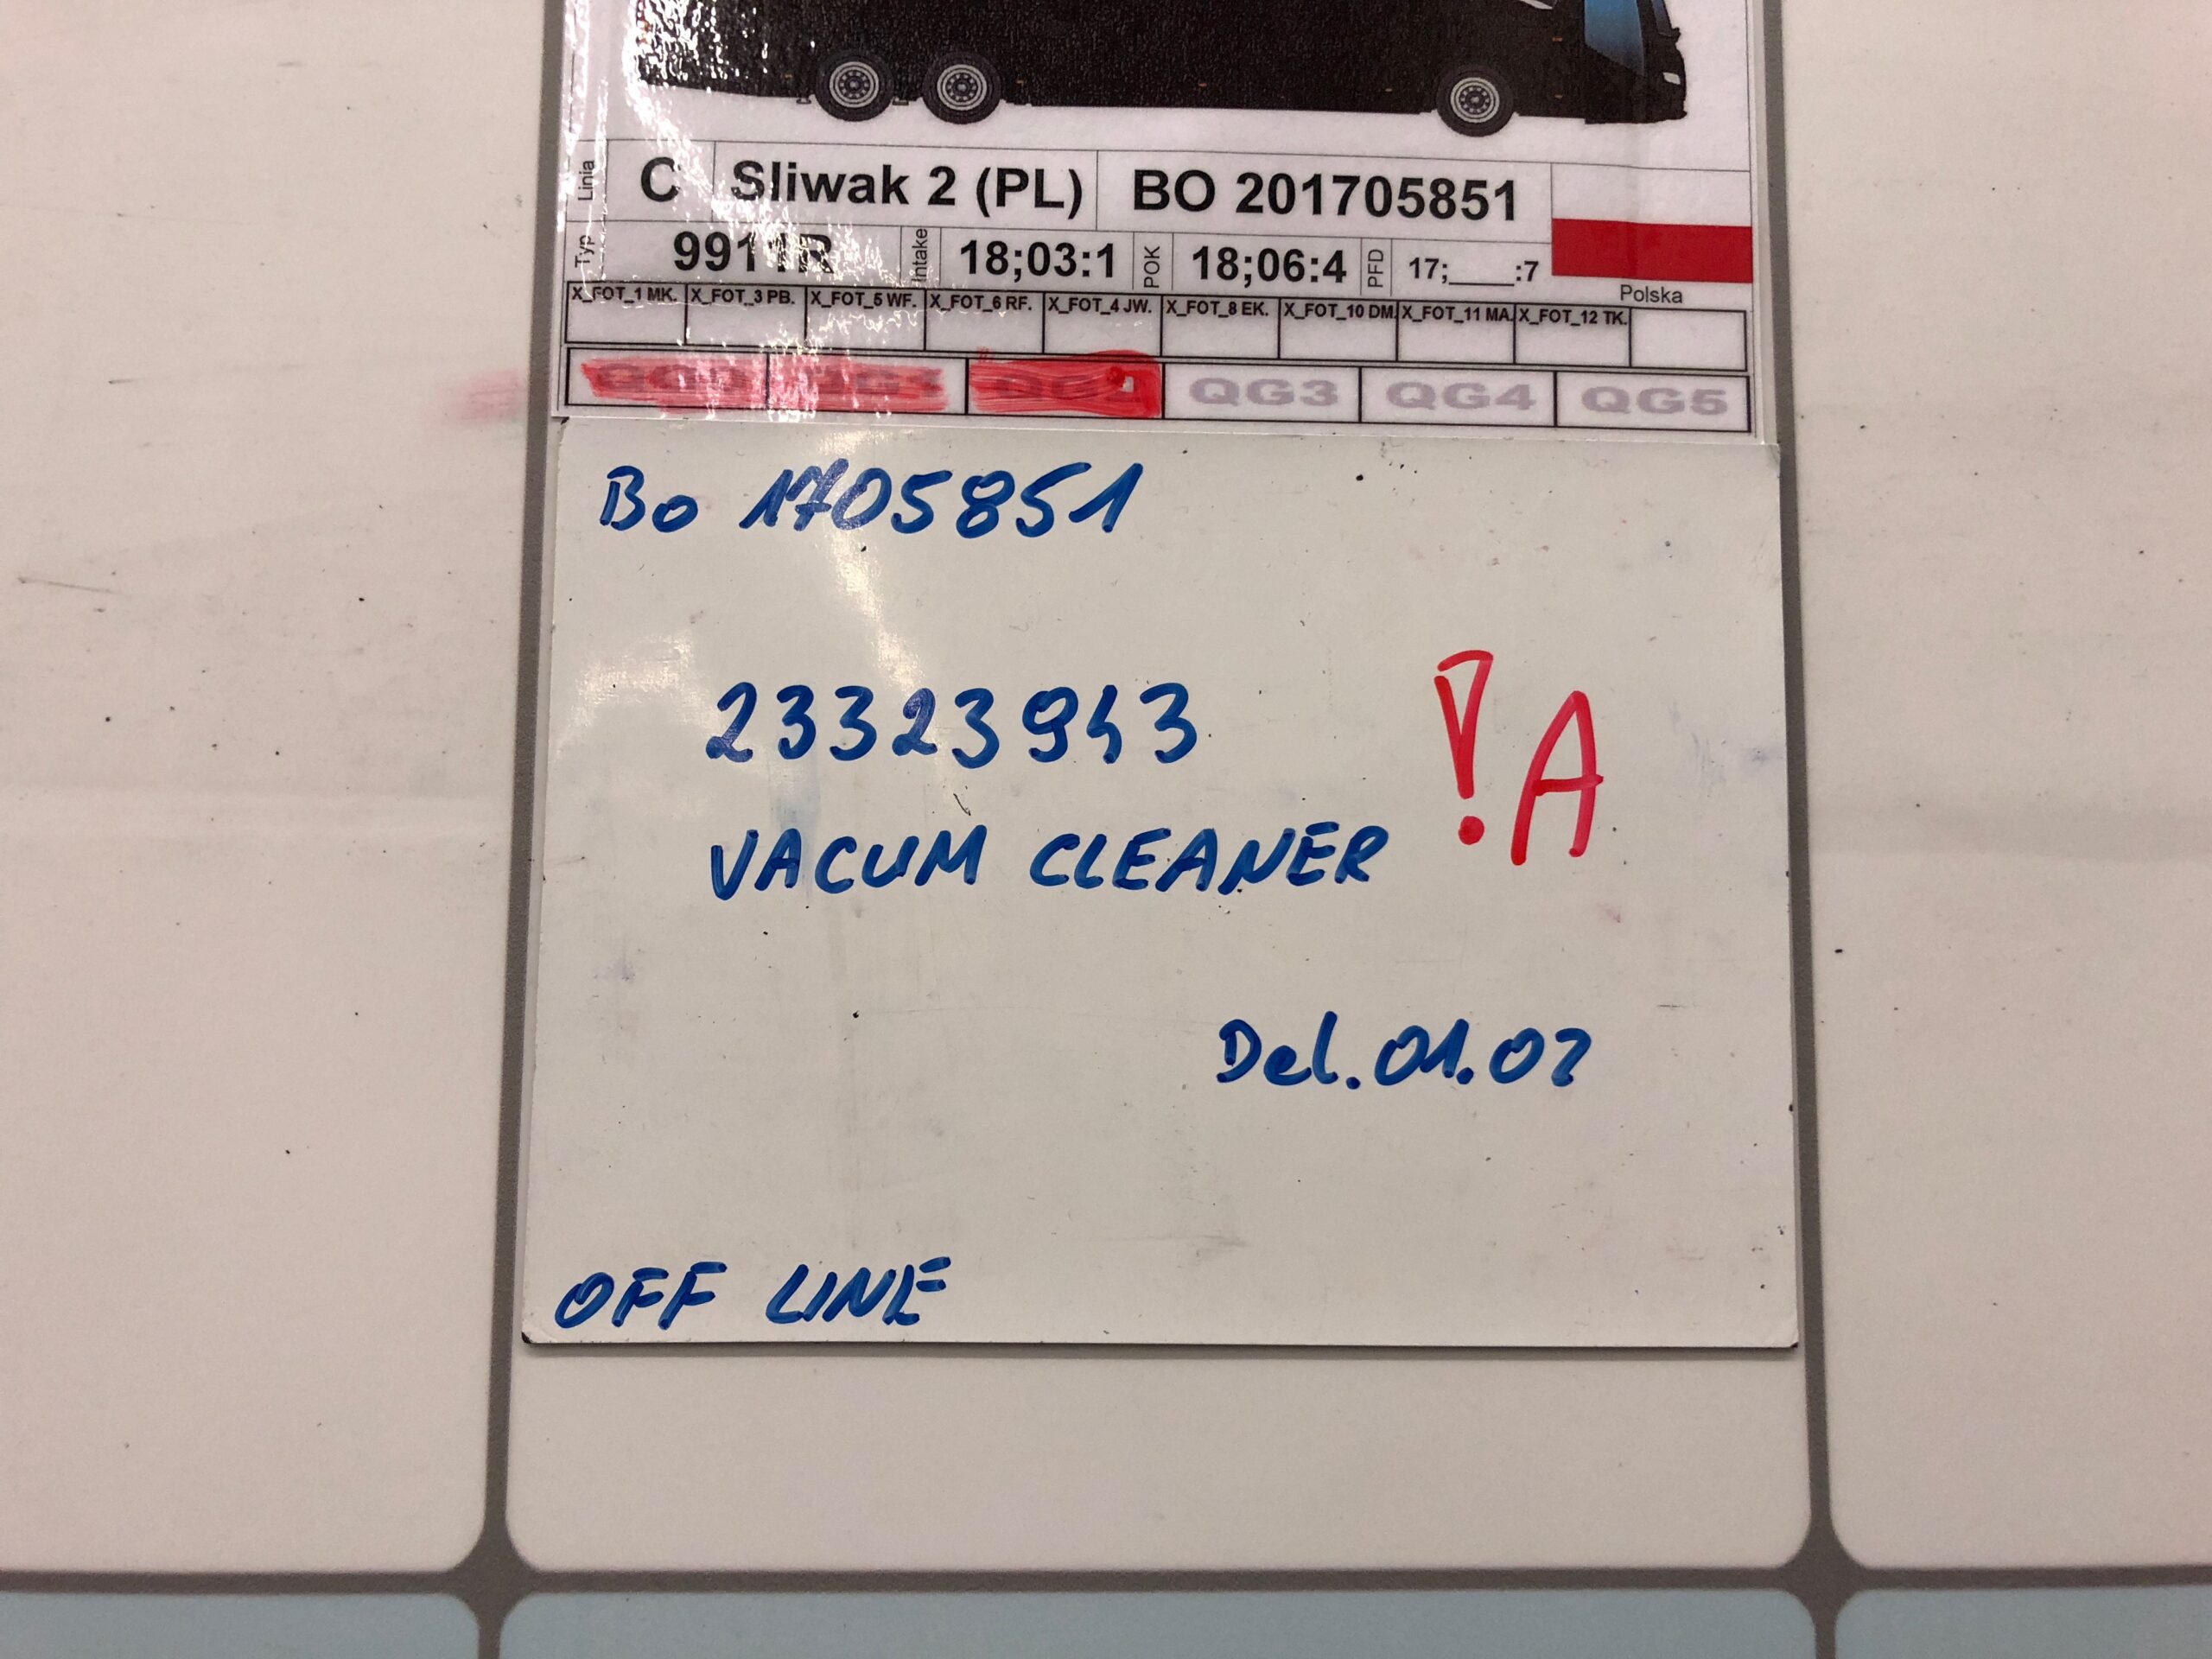
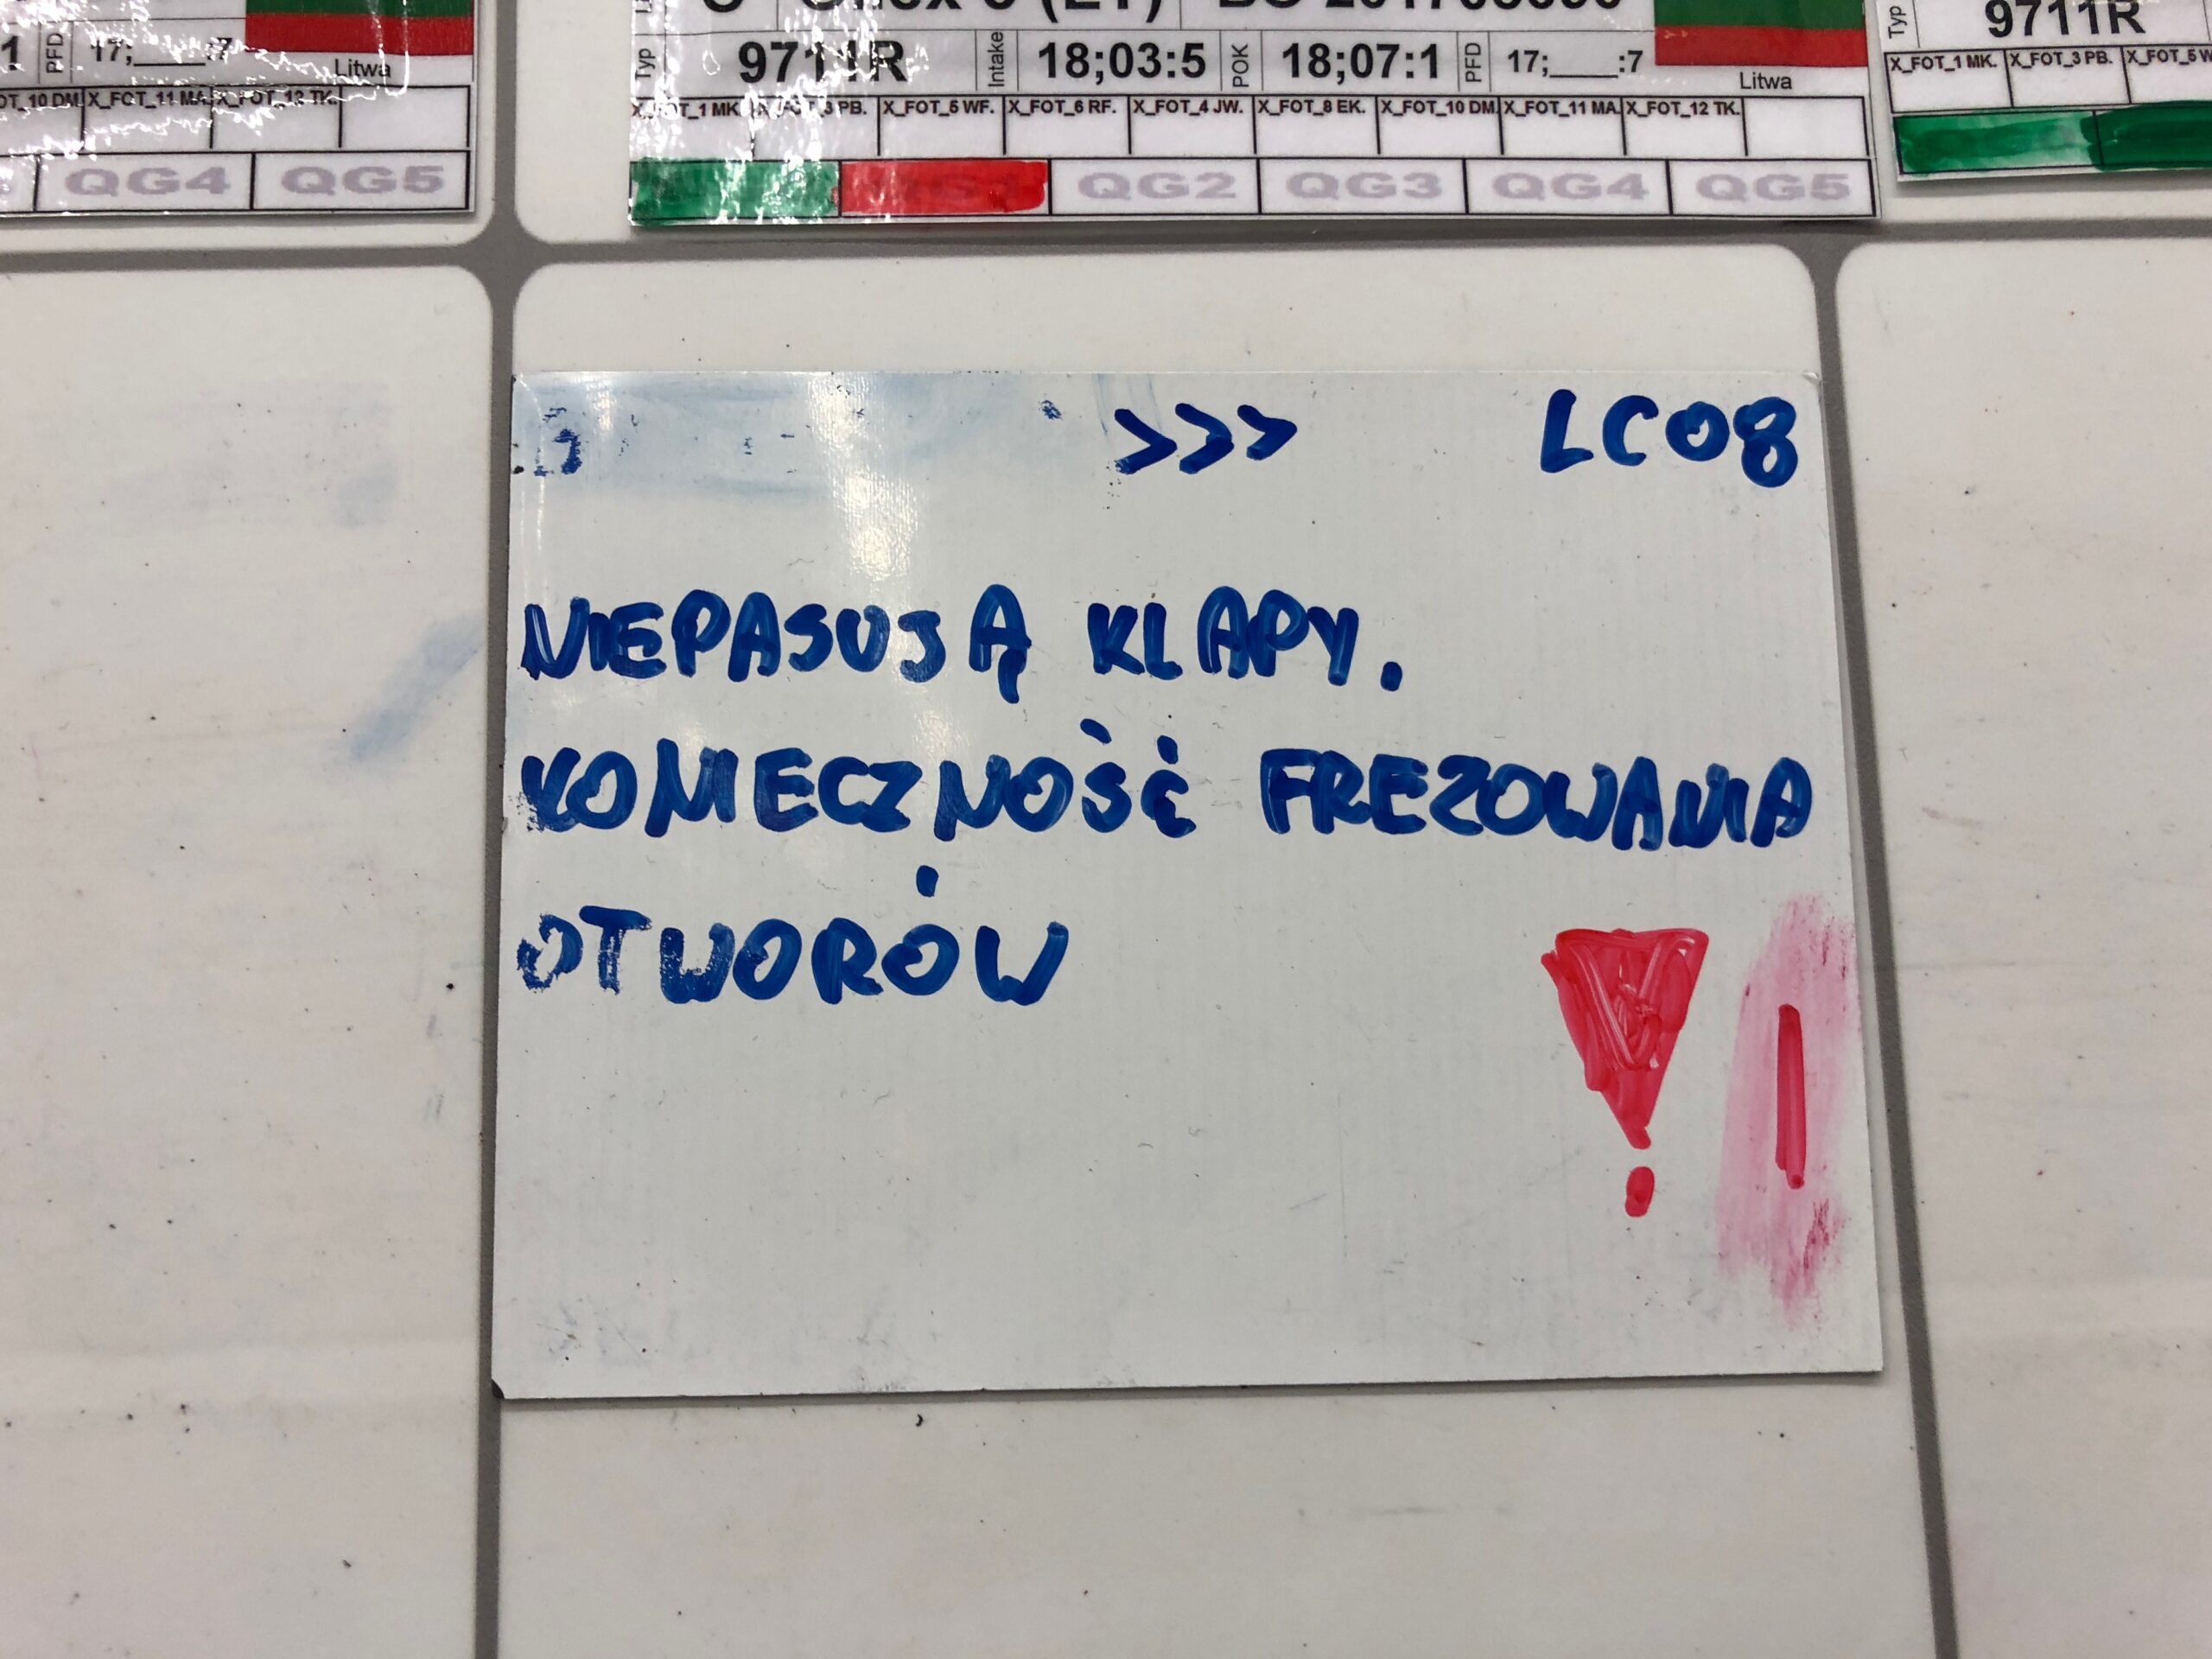
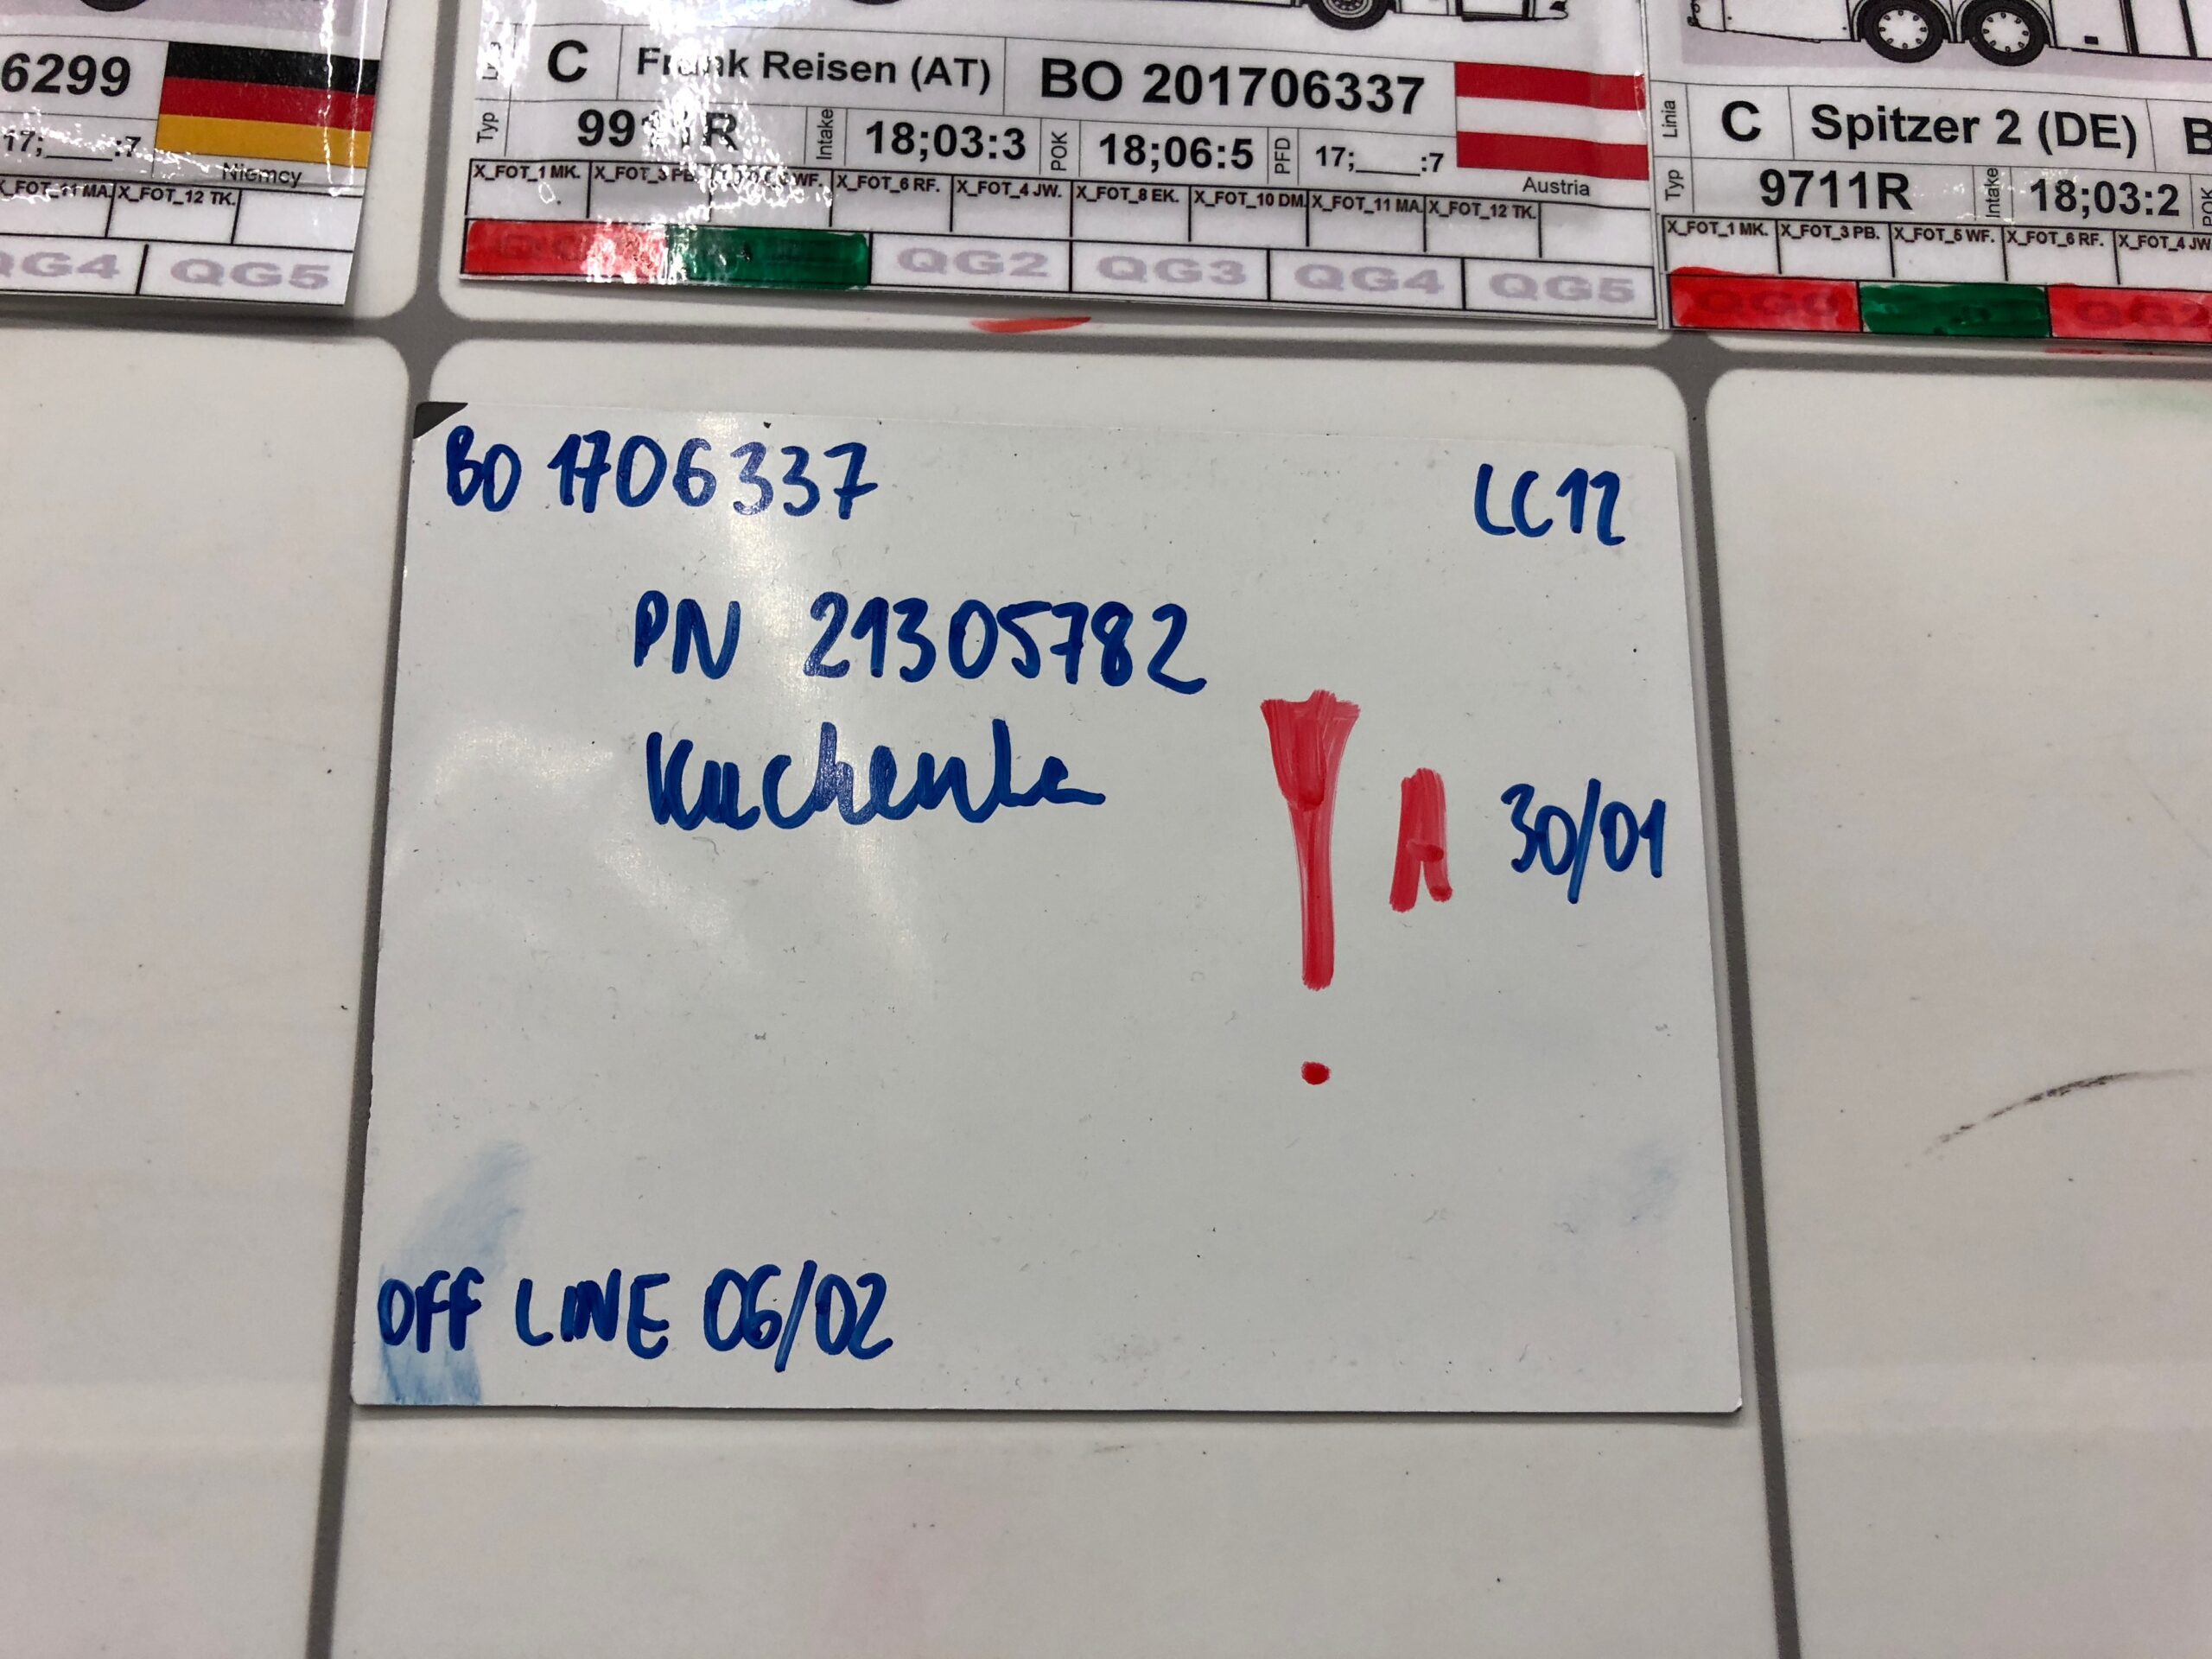
I observed the daily management routine. I photographed the cards in use, recording their position, text, colour and handwritten marks. I reviewed the card types and their relative importance, then used that classification to define the dashboard's hierarchy.
A photographed issue note linked a part number to several vehicles, with request and delivery dates beside it. Those details already belonged together. The digital design kept the issue attached to its production context.


Design
Keep the production map.
Bring the detail into reach.
I kept the line-and-station layout as the main view. Each vehicle keeps its place. Issue cards group beneath it, while the selected line's counts summarise the problems in that area. I designed the dashboard for a feed from the factory's production systems.
Each issue card brings its part reference, quantity, responsible function and dates into a consistent format. A side panel holds the fuller record and action items. The production overview stays visible behind it. The working model stayed intact.
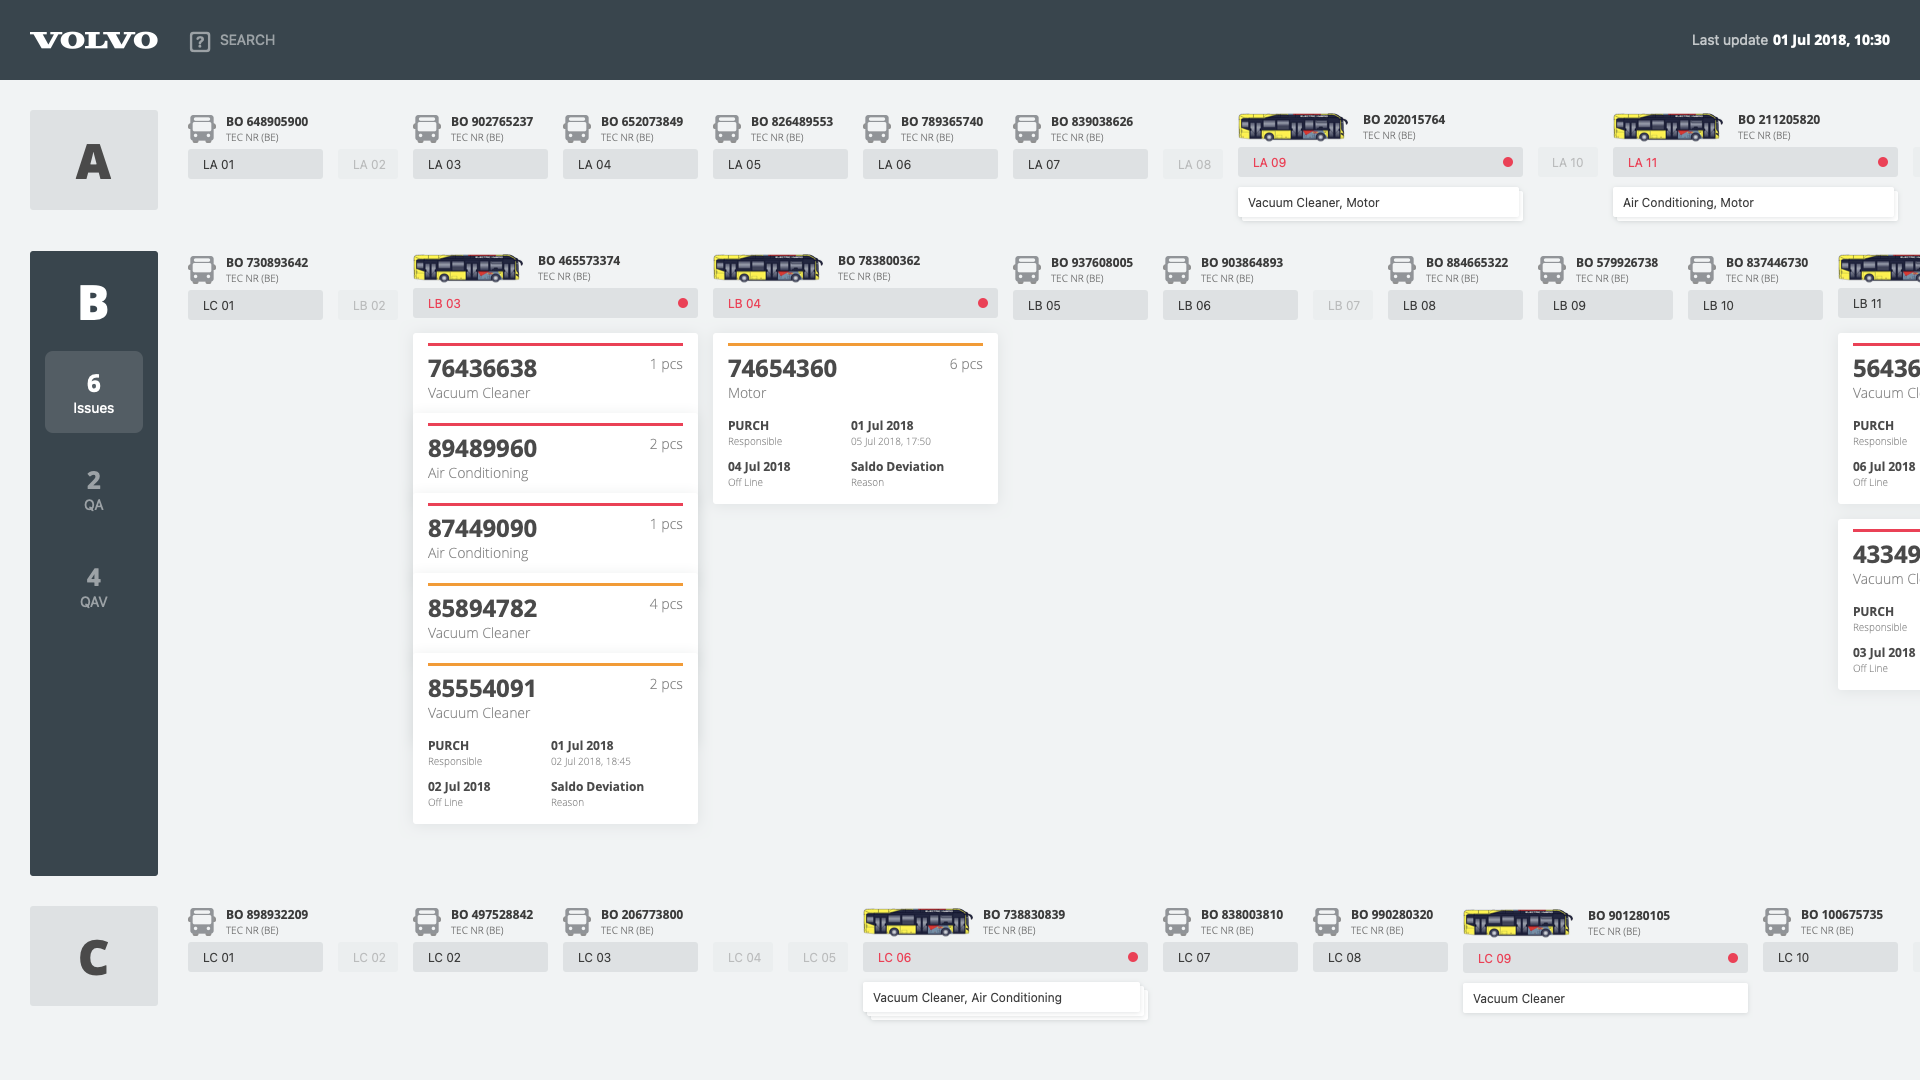
Dashboard design. A/B/C rows and station labels retain the production map; issue cards sit with the affected vehicle, and the selected line's counts summarise its problems.

Detail-panel design. Issue metadata and action items sit beside the production overview, keeping the wider context visible.
Edited reconstruction with illustrative action-item notes. Original designSelect a photograph or design to inspect it at full size.
Handoff
Another team took over the initiative.
My involvement covered field research, information architecture and interface design. The business estimated the initiative's annual savings at 20 working days of meeting preparation and approximately $90,000 in operating costs.
The board gave me a design model. Its lines, stations and attached issue notes showed how managers organised the work; I carried that structure into the digital interface.